|
Download Data (XLS File) |
|
|||||
|
|||||
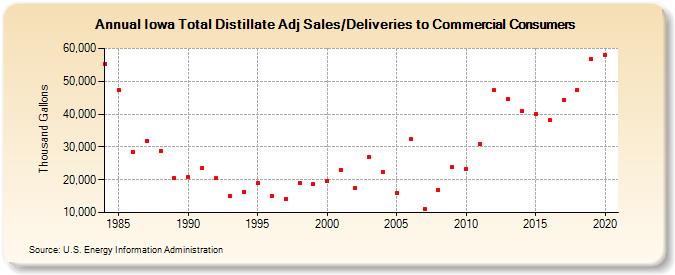
| Iowa Total Distillate Adj Sales/Deliveries to Commercial Consumers (Thousand Gallons) | |||||
| Decade | Year-0 | Year-1 | Year-2 | Year-3 | Year-4 | Year-5 | Year-6 | Year-7 | Year-8 | Year-9 |
|---|---|---|---|---|---|---|---|---|---|---|
| 1980's | 55,396 | 47,323 | 28,593 | 31,893 | 28,766 | 20,565 | ||||
| 1990's | 20,756 | 23,652 | 20,508 | 14,952 | 16,395 | 18,859 | 15,175 | 14,242 | 19,137 | 18,616 |
| 2000's | 19,734 | 23,107 | 17,470 | 26,950 | 22,366 | 16,018 | 32,275 | 11,200 | 17,022 | 23,736 |
| 2010's | 23,272 | 30,826 | 47,263 | 44,677 | 41,055 | 40,003 | 38,106 | 44,315 | 47,338 | 56,676 |
| 2020's | 58,075 |
| - = No Data Reported; -- = Not Applicable; NA = Not Available; W = Withheld to avoid disclosure of individual company data. |
| Release Date: 2/9/2022 |
| Next Release Date: Suspended |