|
Download Data (XLS File) |
|
|||||
|
|||||
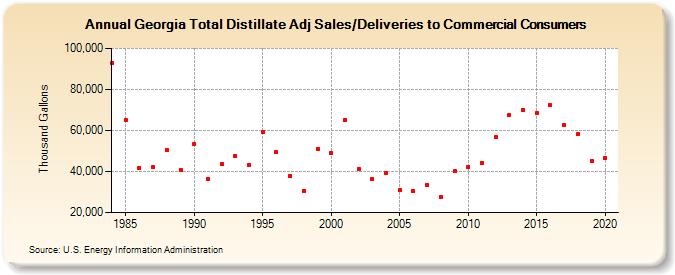
| Georgia Total Distillate Adj Sales/Deliveries to Commercial Consumers (Thousand Gallons) | |||||
| Decade | Year-0 | Year-1 | Year-2 | Year-3 | Year-4 | Year-5 | Year-6 | Year-7 | Year-8 | Year-9 |
|---|---|---|---|---|---|---|---|---|---|---|
| 1980's | 92,985 | 65,071 | 41,664 | 42,160 | 50,504 | 40,934 | ||||
| 1990's | 53,234 | 36,208 | 43,611 | 47,575 | 43,417 | 59,140 | 49,268 | 37,643 | 30,633 | 51,136 |
| 2000's | 49,036 | 65,251 | 41,232 | 36,551 | 39,384 | 30,873 | 30,666 | 33,302 | 27,533 | 40,121 |
| 2010's | 42,429 | 44,322 | 56,581 | 67,617 | 70,096 | 68,606 | 72,318 | 62,436 | 58,155 | 45,342 |
| 2020's | 46,745 |
| - = No Data Reported; -- = Not Applicable; NA = Not Available; W = Withheld to avoid disclosure of individual company data. |
| Release Date: 2/9/2022 |
| Next Release Date: Suspended |