|
Download Data (XLS File) |
|
|||||
|
|||||
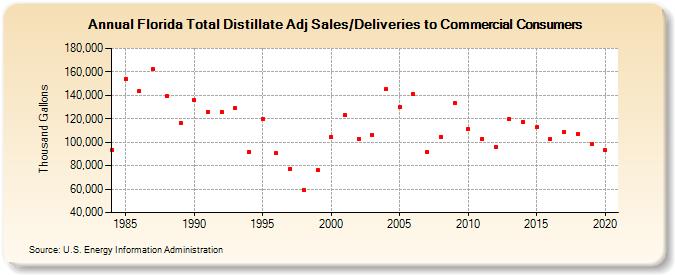
| Florida Total Distillate Adj Sales/Deliveries to Commercial Consumers (Thousand Gallons) | |||||
| Decade | Year-0 | Year-1 | Year-2 | Year-3 | Year-4 | Year-5 | Year-6 | Year-7 | Year-8 | Year-9 |
|---|---|---|---|---|---|---|---|---|---|---|
| 1980's | 93,147 | 153,930 | 143,564 | 162,109 | 139,057 | 116,672 | ||||
| 1990's | 135,866 | 125,977 | 126,150 | 129,126 | 91,858 | 119,833 | 90,379 | 77,364 | 59,595 | 76,028 |
| 2000's | 104,626 | 122,968 | 103,144 | 106,483 | 145,480 | 129,617 | 140,735 | 91,990 | 104,862 | 133,371 |
| 2010's | 110,844 | 102,575 | 95,870 | 119,572 | 117,622 | 112,692 | 102,893 | 108,980 | 107,282 | 98,347 |
| 2020's | 93,022 |
| - = No Data Reported; -- = Not Applicable; NA = Not Available; W = Withheld to avoid disclosure of individual company data. |
| Release Date: 2/9/2022 |
| Next Release Date: Suspended |