|
Download Data (XLS File) |
|
|||||
|
|||||
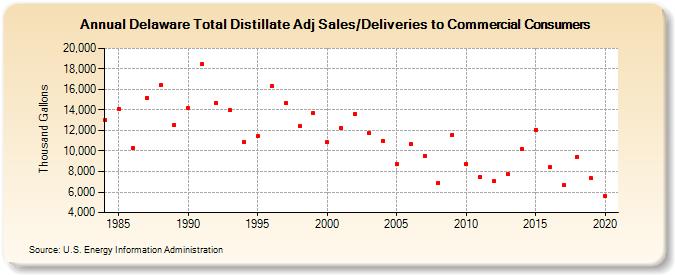
| Delaware Total Distillate Adj Sales/Deliveries to Commercial Consumers (Thousand Gallons) | |||||
| Decade | Year-0 | Year-1 | Year-2 | Year-3 | Year-4 | Year-5 | Year-6 | Year-7 | Year-8 | Year-9 |
|---|---|---|---|---|---|---|---|---|---|---|
| 1980's | 13,008 | 14,056 | 10,267 | 15,196 | 16,393 | 12,513 | ||||
| 1990's | 14,154 | 18,470 | 14,650 | 13,954 | 10,853 | 11,459 | 16,316 | 14,665 | 12,392 | 13,663 |
| 2000's | 10,838 | 12,283 | 13,626 | 11,729 | 10,984 | 8,711 | 10,668 | 9,542 | 6,923 | 11,601 |
| 2010's | 8,755 | 7,470 | 7,042 | 7,712 | 10,207 | 12,072 | 8,408 | 6,678 | 9,423 | 7,329 |
| 2020's | 5,575 |
| - = No Data Reported; -- = Not Applicable; NA = Not Available; W = Withheld to avoid disclosure of individual company data. |
| Release Date: 2/9/2022 |
| Next Release Date: Suspended |