|
Download Data (XLS File) |
|
|||||
|
|||||
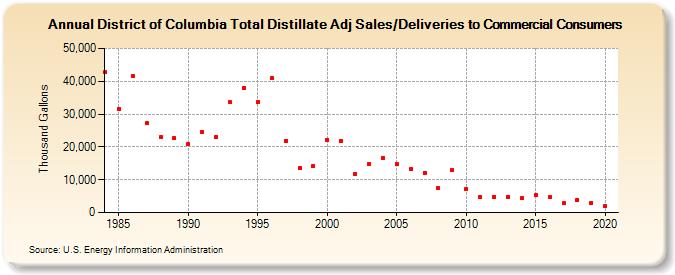
| District of Columbia Total Distillate Adj Sales/Deliveries to Commercial Consumers (Thousand Gallons) | |||||
| Decade | Year-0 | Year-1 | Year-2 | Year-3 | Year-4 | Year-5 | Year-6 | Year-7 | Year-8 | Year-9 |
|---|---|---|---|---|---|---|---|---|---|---|
| 1980's | 42,725 | 31,522 | 41,454 | 27,269 | 22,978 | 22,669 | ||||
| 1990's | 21,007 | 24,653 | 23,147 | 33,576 | 38,069 | 33,777 | 40,964 | 21,920 | 13,618 | 14,147 |
| 2000's | 22,241 | 21,925 | 11,881 | 14,859 | 16,724 | 14,774 | 13,141 | 12,125 | 7,349 | 12,860 |
| 2010's | 7,163 | 4,768 | 4,851 | 4,882 | 4,385 | 5,236 | 4,606 | 2,765 | 3,930 | 2,842 |
| 2020's | 2,016 |
| - = No Data Reported; -- = Not Applicable; NA = Not Available; W = Withheld to avoid disclosure of individual company data. |
| Release Date: 2/9/2022 |
| Next Release Date: Suspended |