|
Download Data (XLS File) |
|
|||||
|
|||||
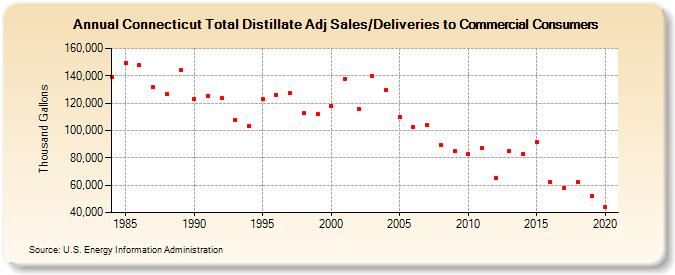
| Connecticut Total Distillate Adj Sales/Deliveries to Commercial Consumers (Thousand Gallons) | |||||
| Decade | Year-0 | Year-1 | Year-2 | Year-3 | Year-4 | Year-5 | Year-6 | Year-7 | Year-8 | Year-9 |
|---|---|---|---|---|---|---|---|---|---|---|
| 1980's | 139,207 | 149,332 | 148,011 | 131,751 | 126,954 | 143,928 | ||||
| 1990's | 122,739 | 125,297 | 123,672 | 107,600 | 103,540 | 122,824 | 126,094 | 127,174 | 112,564 | 111,860 |
| 2000's | 118,199 | 137,823 | 115,898 | 139,838 | 129,647 | 110,102 | 102,781 | 104,019 | 89,567 | 85,233 |
| 2010's | 82,531 | 86,911 | 65,549 | 84,878 | 82,448 | 91,828 | 62,390 | 58,099 | 62,503 | 52,363 |
| 2020's | 44,388 |
| - = No Data Reported; -- = Not Applicable; NA = Not Available; W = Withheld to avoid disclosure of individual company data. |
| Release Date: 2/9/2022 |
| Next Release Date: Suspended |