|
Download Data (XLS File) |
|
|||||
|
|||||
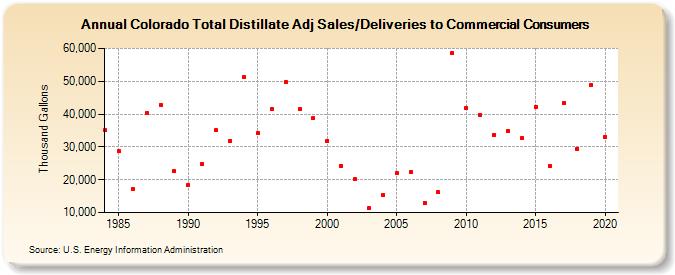
| Colorado Total Distillate Adj Sales/Deliveries to Commercial Consumers (Thousand Gallons) | |||||
| Decade | Year-0 | Year-1 | Year-2 | Year-3 | Year-4 | Year-5 | Year-6 | Year-7 | Year-8 | Year-9 |
|---|---|---|---|---|---|---|---|---|---|---|
| 1980's | 35,020 | 28,659 | 17,030 | 40,252 | 42,770 | 22,623 | ||||
| 1990's | 18,329 | 24,798 | 35,040 | 31,855 | 51,143 | 34,217 | 41,460 | 49,802 | 41,516 | 38,773 |
| 2000's | 31,882 | 24,156 | 20,080 | 11,243 | 15,450 | 22,072 | 22,330 | 12,954 | 16,144 | 58,589 |
| 2010's | 41,950 | 39,783 | 33,685 | 34,900 | 32,653 | 42,262 | 24,304 | 43,329 | 29,483 | 48,922 |
| 2020's | 33,133 |
| - = No Data Reported; -- = Not Applicable; NA = Not Available; W = Withheld to avoid disclosure of individual company data. |
| Release Date: 2/9/2022 |
| Next Release Date: Suspended |