|
Download Data (XLS File) |
|
|||||
|
|||||
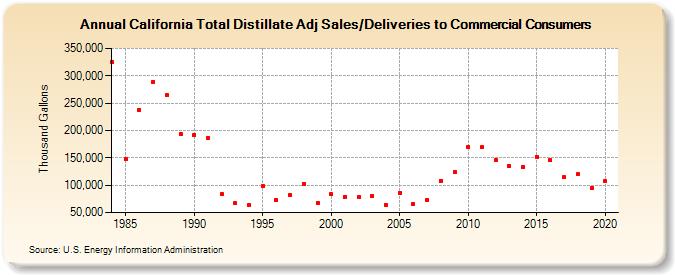
| California Total Distillate Adj Sales/Deliveries to Commercial Consumers (Thousand Gallons) | |||||
| Decade | Year-0 | Year-1 | Year-2 | Year-3 | Year-4 | Year-5 | Year-6 | Year-7 | Year-8 | Year-9 |
|---|---|---|---|---|---|---|---|---|---|---|
| 1980's | 324,757 | 147,907 | 237,284 | 289,047 | 265,230 | 193,766 | ||||
| 1990's | 192,228 | 186,788 | 83,787 | 66,780 | 63,103 | 98,146 | 73,223 | 82,090 | 102,852 | 68,215 |
| 2000's | 83,765 | 79,000 | 77,901 | 80,234 | 63,844 | 86,397 | 66,071 | 73,720 | 108,583 | 123,693 |
| 2010's | 170,637 | 169,205 | 146,366 | 134,977 | 133,338 | 151,756 | 145,270 | 114,411 | 119,560 | 94,857 |
| 2020's | 107,141 |
| - = No Data Reported; -- = Not Applicable; NA = Not Available; W = Withheld to avoid disclosure of individual company data. |
| Release Date: 2/9/2022 |
| Next Release Date: Suspended |