|
Download Data (XLS File) |
|
|||||
|
|||||
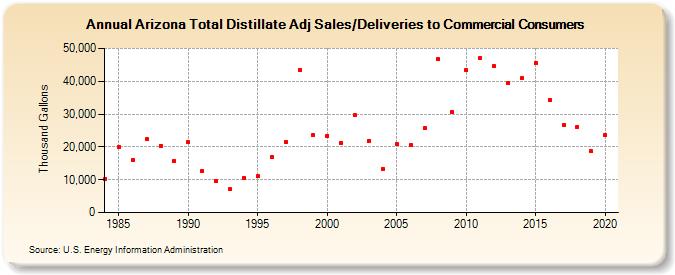
| Arizona Total Distillate Adj Sales/Deliveries to Commercial Consumers (Thousand Gallons) | |||||
| Decade | Year-0 | Year-1 | Year-2 | Year-3 | Year-4 | Year-5 | Year-6 | Year-7 | Year-8 | Year-9 |
|---|---|---|---|---|---|---|---|---|---|---|
| 1980's | 10,217 | 20,042 | 15,991 | 22,266 | 20,391 | 15,715 | ||||
| 1990's | 21,405 | 12,727 | 9,483 | 7,027 | 10,603 | 10,991 | 16,925 | 21,607 | 43,413 | 23,483 |
| 2000's | 23,407 | 21,316 | 29,590 | 21,929 | 13,286 | 20,752 | 20,455 | 25,753 | 46,763 | 30,592 |
| 2010's | 43,338 | 47,075 | 44,493 | 39,318 | 40,867 | 45,403 | 34,352 | 26,736 | 26,085 | 18,669 |
| 2020's | 23,512 |
| - = No Data Reported; -- = Not Applicable; NA = Not Available; W = Withheld to avoid disclosure of individual company data. |
| Release Date: 2/9/2022 |
| Next Release Date: Suspended |