|
Download Data (XLS File) |
|
|||||
|
|||||
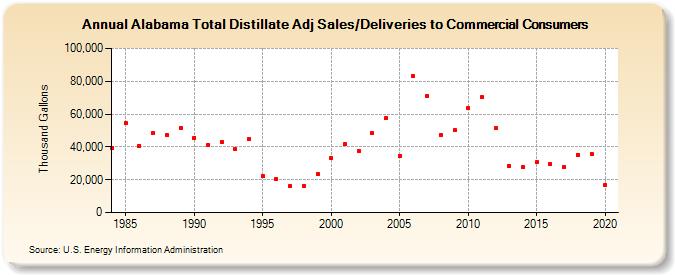
| Alabama Total Distillate Adj Sales/Deliveries to Commercial Consumers (Thousand Gallons) | |||||
| Decade | Year-0 | Year-1 | Year-2 | Year-3 | Year-4 | Year-5 | Year-6 | Year-7 | Year-8 | Year-9 |
|---|---|---|---|---|---|---|---|---|---|---|
| 1980's | 39,313 | 54,318 | 40,758 | 48,271 | 47,236 | 51,571 | ||||
| 1990's | 45,571 | 41,249 | 43,274 | 38,515 | 44,897 | 22,385 | 20,509 | 16,097 | 16,344 | 23,380 |
| 2000's | 33,207 | 41,632 | 37,612 | 48,253 | 57,538 | 34,593 | 82,983 | 71,137 | 47,340 | 50,104 |
| 2010's | 63,402 | 70,142 | 51,240 | 28,444 | 27,511 | 30,563 | 29,475 | 27,681 | 35,238 | 35,773 |
| 2020's | 16,810 |
| - = No Data Reported; -- = Not Applicable; NA = Not Available; W = Withheld to avoid disclosure of individual company data. |
| Release Date: 2/9/2022 |
| Next Release Date: Suspended |