|
Download Data (XLS File) |
|
|||||
|
|||||
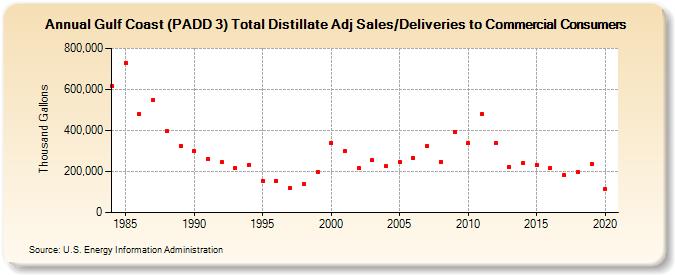
| Gulf Coast (PADD 3) Total Distillate Adj Sales/Deliveries to Commercial Consumers (Thousand Gallons) | |||||
| Decade | Year-0 | Year-1 | Year-2 | Year-3 | Year-4 | Year-5 | Year-6 | Year-7 | Year-8 | Year-9 |
|---|---|---|---|---|---|---|---|---|---|---|
| 1980's | 614,674 | 728,510 | 480,548 | 549,295 | 395,649 | 326,243 | ||||
| 1990's | 297,752 | 262,092 | 246,547 | 219,071 | 232,299 | 154,060 | 156,172 | 120,683 | 138,454 | 197,931 |
| 2000's | 339,430 | 299,198 | 216,901 | 253,825 | 224,982 | 247,306 | 264,916 | 322,511 | 248,040 | 394,384 |
| 2010's | 338,222 | 482,323 | 338,414 | 222,348 | 242,868 | 233,274 | 217,190 | 180,614 | 198,044 | 236,129 |
| 2020's | 115,911 |
| - = No Data Reported; -- = Not Applicable; NA = Not Available; W = Withheld to avoid disclosure of individual company data. |
| Release Date: 2/9/2022 |
| Next Release Date: Suspended |