|
Download Data (XLS File) |
|
|||||
|
|||||
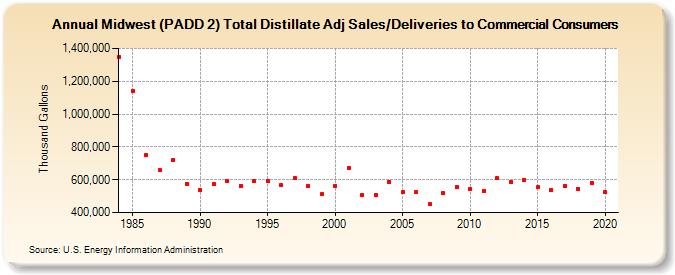
| Midwest (PADD 2) Total Distillate Adj Sales/Deliveries to Commercial Consumers (Thousand Gallons) | |||||
| Decade | Year-0 | Year-1 | Year-2 | Year-3 | Year-4 | Year-5 | Year-6 | Year-7 | Year-8 | Year-9 |
|---|---|---|---|---|---|---|---|---|---|---|
| 1980's | 1,349,197 | 1,139,995 | 749,515 | 659,821 | 717,889 | 575,845 | ||||
| 1990's | 539,239 | 573,660 | 592,776 | 563,907 | 589,602 | 593,639 | 565,136 | 610,444 | 560,518 | 510,839 |
| 2000's | 562,182 | 669,866 | 509,071 | 505,551 | 588,528 | 522,775 | 523,079 | 449,771 | 520,272 | 557,394 |
| 2010's | 543,764 | 533,362 | 608,205 | 587,232 | 600,039 | 553,445 | 539,007 | 560,504 | 545,390 | 581,604 |
| 2020's | 522,644 |
| - = No Data Reported; -- = Not Applicable; NA = Not Available; W = Withheld to avoid disclosure of individual company data. |
| Release Date: 2/9/2022 |
| Next Release Date: Suspended |