|
Download Data (XLS File) |
|
|||||
|
|||||
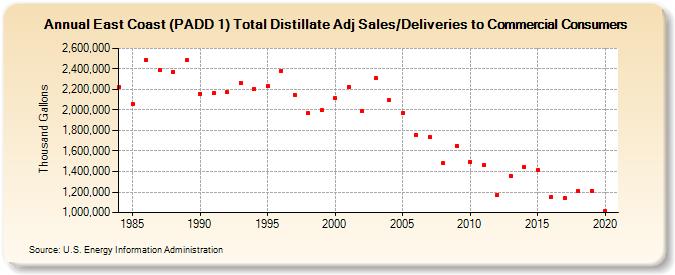
| East Coast (PADD 1) Total Distillate Adj Sales/Deliveries to Commercial Consumers (Thousand Gallons) | |||||
| Decade | Year-0 | Year-1 | Year-2 | Year-3 | Year-4 | Year-5 | Year-6 | Year-7 | Year-8 | Year-9 |
|---|---|---|---|---|---|---|---|---|---|---|
| 1980's | 2,225,741 | 2,059,663 | 2,487,902 | 2,385,143 | 2,370,013 | 2,483,447 | ||||
| 1990's | 2,160,350 | 2,166,511 | 2,170,731 | 2,267,328 | 2,205,780 | 2,231,502 | 2,383,023 | 2,149,556 | 1,967,367 | 1,994,985 |
| 2000's | 2,114,292 | 2,227,698 | 1,991,763 | 2,307,902 | 2,094,220 | 1,965,545 | 1,755,379 | 1,737,229 | 1,480,093 | 1,653,088 |
| 2010's | 1,495,459 | 1,459,197 | 1,175,792 | 1,359,948 | 1,441,094 | 1,410,694 | 1,153,132 | 1,137,822 | 1,210,444 | 1,214,608 |
| 2020's | 1,014,606 |
| - = No Data Reported; -- = Not Applicable; NA = Not Available; W = Withheld to avoid disclosure of individual company data. |
| Release Date: 2/9/2022 |
| Next Release Date: Suspended |