|
Download Data (XLS File) |
|
|||||
|
|||||
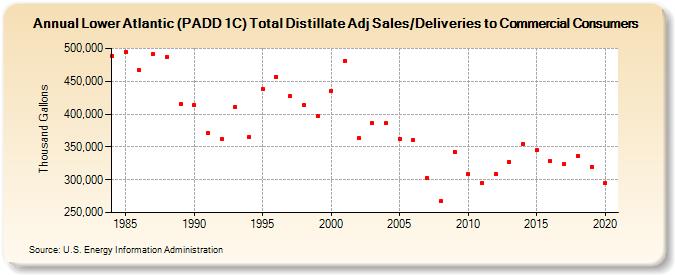
| Lower Atlantic (PADD 1C) Total Distillate Adj Sales/Deliveries to Commercial Consumers (Thousand Gallons) | |||||
| Decade | Year-0 | Year-1 | Year-2 | Year-3 | Year-4 | Year-5 | Year-6 | Year-7 | Year-8 | Year-9 |
|---|---|---|---|---|---|---|---|---|---|---|
| 1980's | 488,867 | 494,885 | 466,538 | 492,095 | 487,609 | 414,744 | ||||
| 1990's | 413,536 | 371,832 | 362,478 | 411,487 | 365,193 | 437,884 | 457,154 | 426,973 | 413,488 | 396,815 |
| 2000's | 435,736 | 481,008 | 363,005 | 386,558 | 385,741 | 361,816 | 360,756 | 302,575 | 266,863 | 342,457 |
| 2010's | 309,080 | 295,570 | 308,452 | 327,509 | 354,686 | 344,799 | 328,483 | 323,255 | 336,718 | 319,780 |
| 2020's | 294,693 |
| - = No Data Reported; -- = Not Applicable; NA = Not Available; W = Withheld to avoid disclosure of individual company data. |
| Release Date: 2/9/2022 |
| Next Release Date: Suspended |