|
Download Data (XLS File) |
|
|||||
|
|||||
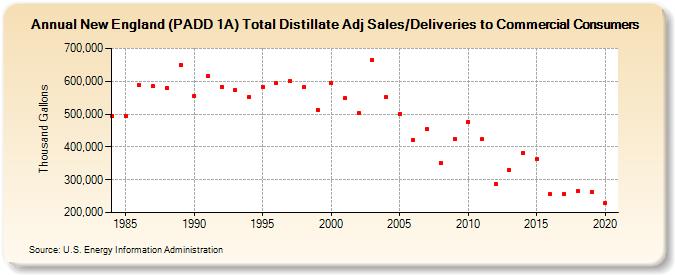
| New England (PADD 1A) Total Distillate Adj Sales/Deliveries to Commercial Consumers (Thousand Gallons) | |||||
| Decade | Year-0 | Year-1 | Year-2 | Year-3 | Year-4 | Year-5 | Year-6 | Year-7 | Year-8 | Year-9 |
|---|---|---|---|---|---|---|---|---|---|---|
| 1980's | 494,102 | 494,247 | 588,010 | 584,221 | 580,541 | 650,297 | ||||
| 1990's | 556,412 | 615,256 | 583,636 | 573,671 | 552,211 | 583,812 | 594,280 | 601,436 | 580,952 | 513,496 |
| 2000's | 593,710 | 547,583 | 502,734 | 664,384 | 550,778 | 500,831 | 420,578 | 453,062 | 352,051 | 424,032 |
| 2010's | 476,856 | 422,996 | 287,670 | 330,524 | 382,765 | 363,678 | 255,619 | 256,187 | 265,534 | 263,378 |
| 2020's | 228,104 |
| - = No Data Reported; -- = Not Applicable; NA = Not Available; W = Withheld to avoid disclosure of individual company data. |
| Release Date: 2/9/2022 |
| Next Release Date: Suspended |