|
Download Data (XLS File) |
|
|||||
|
|||||
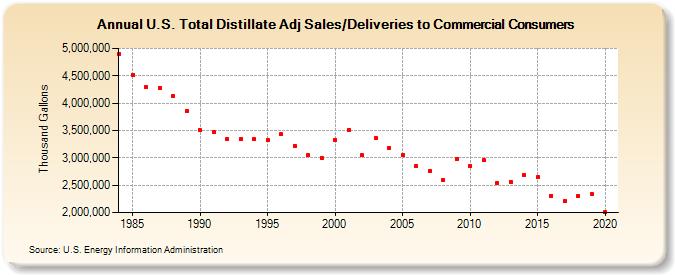
| U.S. Total Distillate Adj Sales/Deliveries to Commercial Consumers (Thousand Gallons) | |||||
| Decade | Year-0 | Year-1 | Year-2 | Year-3 | Year-4 | Year-5 | Year-6 | Year-7 | Year-8 | Year-9 |
|---|---|---|---|---|---|---|---|---|---|---|
| 1980's | 4,904,727 | 4,514,211 | 4,293,095 | 4,279,375 | 4,135,079 | 3,858,743 | ||||
| 1990's | 3,502,778 | 3,471,468 | 3,347,133 | 3,342,105 | 3,343,090 | 3,318,818 | 3,433,555 | 3,218,497 | 3,044,495 | 3,003,653 |
| 2000's | 3,324,687 | 3,512,488 | 3,043,558 | 3,362,585 | 3,186,596 | 3,048,881 | 2,846,623 | 2,763,566 | 2,591,797 | 2,979,534 |
| 2010's | 2,856,825 | 2,952,495 | 2,546,420 | 2,567,224 | 2,685,730 | 2,645,363 | 2,308,603 | 2,214,502 | 2,304,725 | 2,339,426 |
| 2020's | 2,013,097 |
| - = No Data Reported; -- = Not Applicable; NA = Not Available; W = Withheld to avoid disclosure of individual company data. |
| Release Date: 2/9/2022 |
| Next Release Date: Suspended |