|
Download Data (XLS File) |
|
|||||
|
|||||
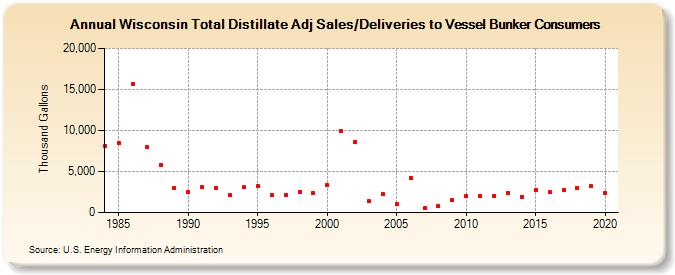
| Wisconsin Total Distillate Adj Sales/Deliveries to Vessel Bunker Consumers (Thousand Gallons) | |||||
| Decade | Year-0 | Year-1 | Year-2 | Year-3 | Year-4 | Year-5 | Year-6 | Year-7 | Year-8 | Year-9 |
|---|---|---|---|---|---|---|---|---|---|---|
| 1980's | 8,117 | 8,429 | 15,650 | 8,029 | 5,828 | 3,022 | ||||
| 1990's | 2,483 | 3,054 | 3,027 | 2,091 | 3,072 | 3,239 | 2,103 | 2,156 | 2,548 | 2,433 |
| 2000's | 3,308 | 9,950 | 8,649 | 1,351 | 2,232 | 982 | 4,269 | 507 | 739 | 1,524 |
| 2010's | 1,962 | 1,991 | 2,021 | 2,417 | 1,902 | 2,779 | 2,466 | 2,741 | 2,961 | 3,179 |
| 2020's | 2,389 |
| - = No Data Reported; -- = Not Applicable; NA = Not Available; W = Withheld to avoid disclosure of individual company data. |
| Release Date: 2/9/2022 |
| Next Release Date: Suspended |