|
Download Data (XLS File) |
|
|||||
|
|||||
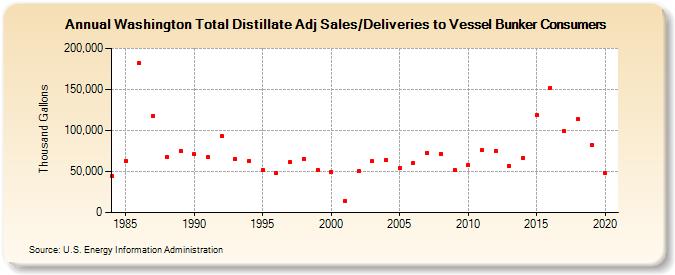
| Washington Total Distillate Adj Sales/Deliveries to Vessel Bunker Consumers (Thousand Gallons) | |||||
| Decade | Year-0 | Year-1 | Year-2 | Year-3 | Year-4 | Year-5 | Year-6 | Year-7 | Year-8 | Year-9 |
|---|---|---|---|---|---|---|---|---|---|---|
| 1980's | 44,177 | 62,985 | 181,921 | 117,752 | 67,352 | 75,565 | ||||
| 1990's | 71,029 | 67,318 | 93,320 | 65,364 | 63,301 | 52,230 | 48,119 | 61,637 | 65,560 | 51,850 |
| 2000's | 49,919 | 14,185 | 50,264 | 62,490 | 64,619 | 53,799 | 60,929 | 72,941 | 71,909 | 51,915 |
| 2010's | 57,708 | 76,072 | 75,231 | 56,643 | 66,543 | 118,549 | 152,124 | 99,822 | 113,413 | 82,504 |
| 2020's | 47,720 |
| - = No Data Reported; -- = Not Applicable; NA = Not Available; W = Withheld to avoid disclosure of individual company data. |
| Release Date: 2/9/2022 |
| Next Release Date: Suspended |