|
Download Data (XLS File) |
|
|||||
|
|||||
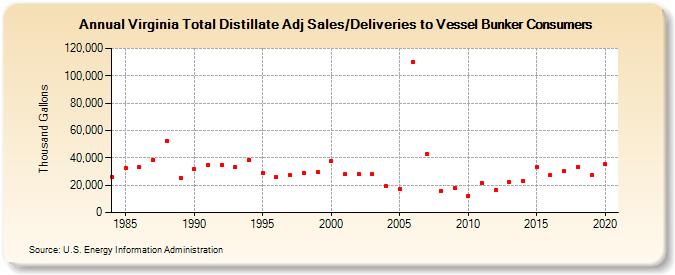
| Virginia Total Distillate Adj Sales/Deliveries to Vessel Bunker Consumers (Thousand Gallons) | |||||
| Decade | Year-0 | Year-1 | Year-2 | Year-3 | Year-4 | Year-5 | Year-6 | Year-7 | Year-8 | Year-9 |
|---|---|---|---|---|---|---|---|---|---|---|
| 1980's | 25,825 | 32,548 | 33,115 | 38,282 | 52,397 | 25,289 | ||||
| 1990's | 31,726 | 35,027 | 34,984 | 32,994 | 38,469 | 28,866 | 26,093 | 27,220 | 28,989 | 29,444 |
| 2000's | 37,981 | 27,885 | 28,035 | 27,897 | 19,372 | 17,308 | 110,218 | 42,525 | 15,774 | 17,684 |
| 2010's | 12,453 | 21,944 | 16,514 | 22,006 | 22,783 | 33,416 | 27,249 | 30,146 | 33,660 | 27,451 |
| 2020's | 35,139 |
| - = No Data Reported; -- = Not Applicable; NA = Not Available; W = Withheld to avoid disclosure of individual company data. |
| Release Date: 2/9/2022 |
| Next Release Date: Suspended |