|
Download Data (XLS File) |
|
|||||
|
|||||
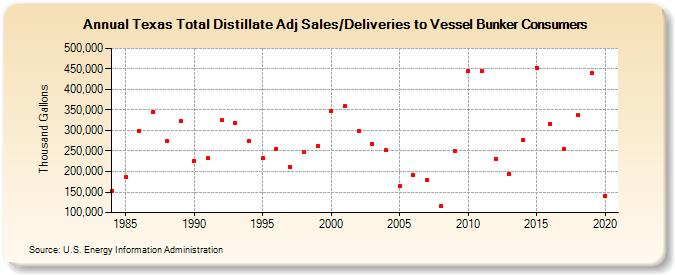
| Texas Total Distillate Adj Sales/Deliveries to Vessel Bunker Consumers (Thousand Gallons) | |||||
| Decade | Year-0 | Year-1 | Year-2 | Year-3 | Year-4 | Year-5 | Year-6 | Year-7 | Year-8 | Year-9 |
|---|---|---|---|---|---|---|---|---|---|---|
| 1980's | 152,210 | 187,321 | 299,698 | 345,293 | 274,752 | 322,318 | ||||
| 1990's | 225,408 | 232,790 | 325,043 | 318,604 | 274,727 | 231,850 | 256,001 | 210,998 | 246,427 | 261,347 |
| 2000's | 347,444 | 358,607 | 299,149 | 268,251 | 251,894 | 164,334 | 191,240 | 179,733 | 114,884 | 250,032 |
| 2010's | 445,319 | 444,050 | 231,093 | 194,647 | 277,953 | 453,214 | 316,300 | 255,128 | 337,084 | 438,896 |
| 2020's | 141,071 |
| - = No Data Reported; -- = Not Applicable; NA = Not Available; W = Withheld to avoid disclosure of individual company data. |
| Release Date: 2/9/2022 |
| Next Release Date: Suspended |