|
Download Data (XLS File) |
|
|||||
|
|||||
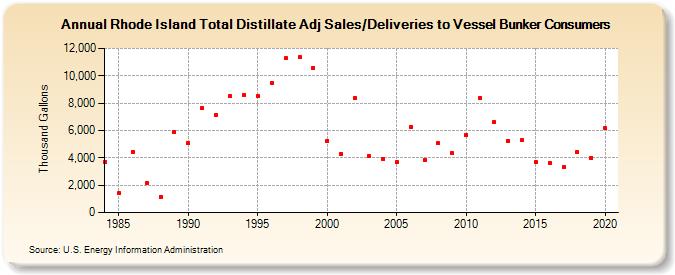
| Rhode Island Total Distillate Adj Sales/Deliveries to Vessel Bunker Consumers (Thousand Gallons) | |||||
| Decade | Year-0 | Year-1 | Year-2 | Year-3 | Year-4 | Year-5 | Year-6 | Year-7 | Year-8 | Year-9 |
|---|---|---|---|---|---|---|---|---|---|---|
| 1980's | 3,726 | 1,405 | 4,439 | 2,125 | 1,173 | 5,896 | ||||
| 1990's | 5,071 | 7,628 | 7,136 | 8,507 | 8,575 | 8,529 | 9,481 | 11,272 | 11,343 | 10,578 |
| 2000's | 5,260 | 4,298 | 8,370 | 4,118 | 3,924 | 3,693 | 6,253 | 3,856 | 5,064 | 4,331 |
| 2010's | 5,697 | 8,403 | 6,622 | 5,256 | 5,273 | 3,708 | 3,653 | 3,342 | 4,409 | 4,023 |
| 2020's | 6,160 |
| - = No Data Reported; -- = Not Applicable; NA = Not Available; W = Withheld to avoid disclosure of individual company data. |
| Release Date: 2/9/2022 |
| Next Release Date: Suspended |