|
Download Data (XLS File) |
|
|||||
|
|||||
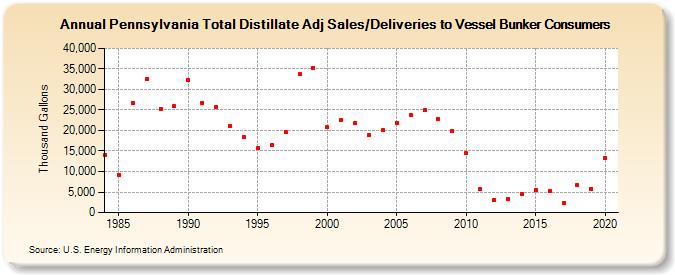
| Pennsylvania Total Distillate Adj Sales/Deliveries to Vessel Bunker Consumers (Thousand Gallons) | |||||
| Decade | Year-0 | Year-1 | Year-2 | Year-3 | Year-4 | Year-5 | Year-6 | Year-7 | Year-8 | Year-9 |
|---|---|---|---|---|---|---|---|---|---|---|
| 1980's | 14,123 | 9,212 | 26,594 | 32,523 | 25,185 | 25,854 | ||||
| 1990's | 32,263 | 26,807 | 25,737 | 21,173 | 18,383 | 15,648 | 16,467 | 19,694 | 33,817 | 35,315 |
| 2000's | 20,742 | 22,477 | 21,824 | 18,813 | 20,035 | 21,785 | 23,857 | 24,889 | 22,794 | 19,898 |
| 2010's | 14,427 | 5,769 | 3,008 | 3,372 | 4,542 | 5,470 | 5,261 | 2,410 | 6,826 | 5,760 |
| 2020's | 13,304 |
| - = No Data Reported; -- = Not Applicable; NA = Not Available; W = Withheld to avoid disclosure of individual company data. |
| Release Date: 2/9/2022 |
| Next Release Date: Suspended |