|
Download Data (XLS File) |
|
|||||
|
|||||
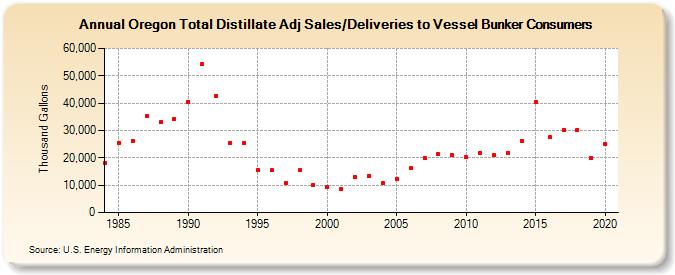
| Oregon Total Distillate Adj Sales/Deliveries to Vessel Bunker Consumers (Thousand Gallons) | |||||
| Decade | Year-0 | Year-1 | Year-2 | Year-3 | Year-4 | Year-5 | Year-6 | Year-7 | Year-8 | Year-9 |
|---|---|---|---|---|---|---|---|---|---|---|
| 1980's | 18,001 | 25,598 | 26,304 | 35,403 | 33,063 | 34,274 | ||||
| 1990's | 40,543 | 54,202 | 42,702 | 25,532 | 25,328 | 15,467 | 15,551 | 10,854 | 15,434 | 9,995 |
| 2000's | 9,239 | 8,445 | 13,040 | 13,400 | 10,633 | 12,385 | 16,227 | 19,982 | 21,332 | 20,874 |
| 2010's | 20,208 | 21,897 | 20,973 | 21,939 | 26,330 | 40,376 | 27,583 | 30,352 | 30,229 | 20,100 |
| 2020's | 25,097 |
| - = No Data Reported; -- = Not Applicable; NA = Not Available; W = Withheld to avoid disclosure of individual company data. |
| Release Date: 2/9/2022 |
| Next Release Date: Suspended |