|
Download Data (XLS File) |
|
|||||
|
|||||
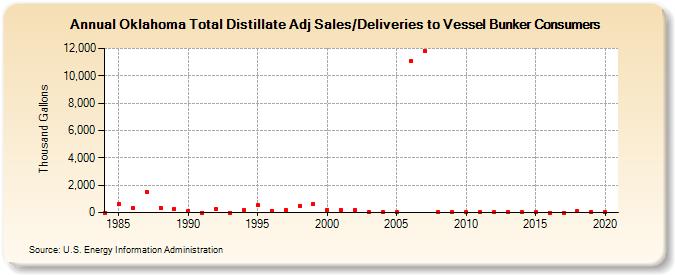
| Oklahoma Total Distillate Adj Sales/Deliveries to Vessel Bunker Consumers (Thousand Gallons) | |||||
| Decade | Year-0 | Year-1 | Year-2 | Year-3 | Year-4 | Year-5 | Year-6 | Year-7 | Year-8 | Year-9 |
|---|---|---|---|---|---|---|---|---|---|---|
| 1980's | 0 | 613 | 361 | 1,523 | 369 | 266 | ||||
| 1990's | 104 | 0 | 246 | 3 | 201 | 527 | 147 | 170 | 515 | 614 |
| 2000's | 189 | 159 | 169 | 7 | 7 | 29 | 11,065 | 11,840 | 10 | 9 |
| 2010's | 11 | 7 | 8 | 6 | 6 | 5 | 1 | 4 | 78 | 71 |
| 2020's | 44 |
| - = No Data Reported; -- = Not Applicable; NA = Not Available; W = Withheld to avoid disclosure of individual company data. |
| Release Date: 2/9/2022 |
| Next Release Date: Suspended |