|
Download Data (XLS File) |
|
|||||
|
|||||
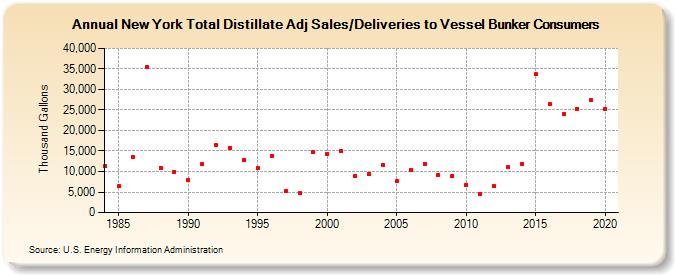
| New York Total Distillate Adj Sales/Deliveries to Vessel Bunker Consumers (Thousand Gallons) | |||||
| Decade | Year-0 | Year-1 | Year-2 | Year-3 | Year-4 | Year-5 | Year-6 | Year-7 | Year-8 | Year-9 |
|---|---|---|---|---|---|---|---|---|---|---|
| 1980's | 11,312 | 6,393 | 13,507 | 35,488 | 10,926 | 9,925 | ||||
| 1990's | 7,887 | 11,749 | 16,399 | 15,800 | 12,860 | 10,936 | 13,882 | 5,166 | 4,774 | 14,658 |
| 2000's | 14,302 | 15,032 | 8,895 | 9,336 | 11,600 | 7,638 | 10,458 | 11,934 | 9,192 | 8,974 |
| 2010's | 6,719 | 4,531 | 6,481 | 11,108 | 11,891 | 33,643 | 26,458 | 23,977 | 25,337 | 27,360 |
| 2020's | 25,178 |
| - = No Data Reported; -- = Not Applicable; NA = Not Available; W = Withheld to avoid disclosure of individual company data. |
| Release Date: 2/9/2022 |
| Next Release Date: Suspended |