|
Download Data (XLS File) |
|
|||||
|
|||||
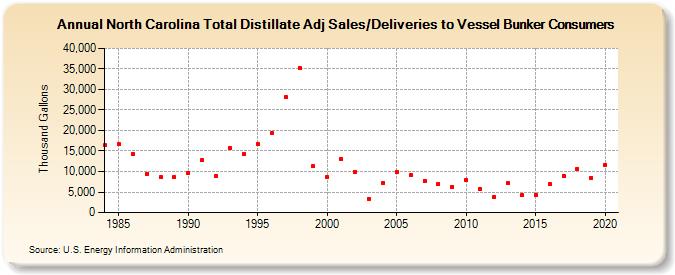
| North Carolina Total Distillate Adj Sales/Deliveries to Vessel Bunker Consumers (Thousand Gallons) | |||||
| Decade | Year-0 | Year-1 | Year-2 | Year-3 | Year-4 | Year-5 | Year-6 | Year-7 | Year-8 | Year-9 |
|---|---|---|---|---|---|---|---|---|---|---|
| 1980's | 16,390 | 16,608 | 14,240 | 9,493 | 8,625 | 8,638 | ||||
| 1990's | 9,613 | 12,801 | 8,955 | 15,729 | 14,213 | 16,722 | 19,332 | 28,110 | 35,255 | 11,279 |
| 2000's | 8,614 | 13,104 | 9,986 | 3,410 | 7,315 | 9,974 | 9,047 | 7,746 | 7,038 | 6,291 |
| 2010's | 8,052 | 5,712 | 3,819 | 7,125 | 4,200 | 4,219 | 6,920 | 8,921 | 10,708 | 8,485 |
| 2020's | 11,663 |
| - = No Data Reported; -- = Not Applicable; NA = Not Available; W = Withheld to avoid disclosure of individual company data. |
| Release Date: 2/9/2022 |
| Next Release Date: Suspended |