|
Download Data (XLS File) |
|
|||||
|
|||||
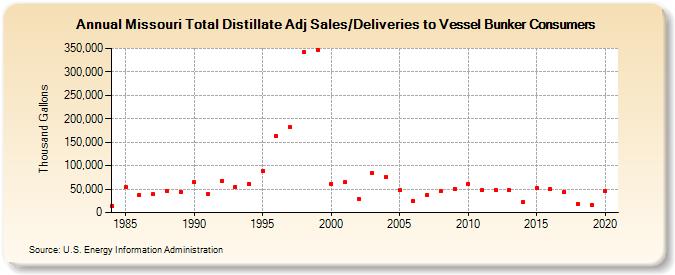
| Missouri Total Distillate Adj Sales/Deliveries to Vessel Bunker Consumers (Thousand Gallons) | |||||
| Decade | Year-0 | Year-1 | Year-2 | Year-3 | Year-4 | Year-5 | Year-6 | Year-7 | Year-8 | Year-9 |
|---|---|---|---|---|---|---|---|---|---|---|
| 1980's | 13,794 | 54,696 | 37,805 | 38,863 | 46,860 | 44,001 | ||||
| 1990's | 64,101 | 39,740 | 67,827 | 54,931 | 61,705 | 88,875 | 163,421 | 182,450 | 341,792 | 347,323 |
| 2000's | 61,472 | 64,423 | 29,950 | 84,844 | 75,378 | 47,373 | 24,583 | 37,572 | 45,402 | 51,176 |
| 2010's | 61,567 | 47,959 | 47,927 | 48,323 | 21,649 | 51,369 | 49,187 | 43,638 | 19,093 | 16,724 |
| 2020's | 45,675 |
| - = No Data Reported; -- = Not Applicable; NA = Not Available; W = Withheld to avoid disclosure of individual company data. |
| Release Date: 2/9/2022 |
| Next Release Date: Suspended |