|
Download Data (XLS File) |
|
|||||
|
|||||
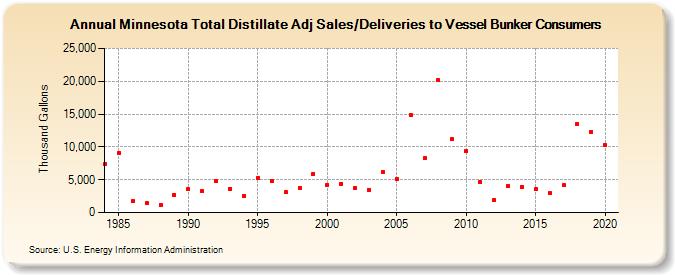
| Minnesota Total Distillate Adj Sales/Deliveries to Vessel Bunker Consumers (Thousand Gallons) | |||||
| Decade | Year-0 | Year-1 | Year-2 | Year-3 | Year-4 | Year-5 | Year-6 | Year-7 | Year-8 | Year-9 |
|---|---|---|---|---|---|---|---|---|---|---|
| 1980's | 7,339 | 9,075 | 1,740 | 1,431 | 1,165 | 2,674 | ||||
| 1990's | 3,546 | 3,277 | 4,757 | 3,626 | 2,582 | 5,311 | 4,835 | 3,059 | 3,791 | 5,916 |
| 2000's | 4,240 | 4,424 | 3,726 | 3,498 | 6,147 | 5,125 | 14,902 | 8,306 | 20,160 | 11,166 |
| 2010's | 9,419 | 4,651 | 1,934 | 4,066 | 3,936 | 3,567 | 3,001 | 4,139 | 13,452 | 12,318 |
| 2020's | 10,283 |
| - = No Data Reported; -- = Not Applicable; NA = Not Available; W = Withheld to avoid disclosure of individual company data. |
| Release Date: 2/9/2022 |
| Next Release Date: Suspended |