|
Download Data (XLS File) |
|
|||||
|
|||||
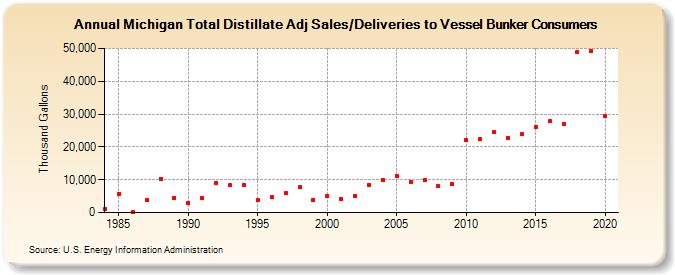
| Michigan Total Distillate Adj Sales/Deliveries to Vessel Bunker Consumers (Thousand Gallons) | |||||
| Decade | Year-0 | Year-1 | Year-2 | Year-3 | Year-4 | Year-5 | Year-6 | Year-7 | Year-8 | Year-9 |
|---|---|---|---|---|---|---|---|---|---|---|
| 1980's | 1,191 | 5,748 | 233 | 3,934 | 10,373 | 4,558 | ||||
| 1990's | 3,040 | 4,468 | 9,070 | 8,292 | 8,403 | 3,778 | 4,753 | 5,947 | 7,755 | 3,942 |
| 2000's | 4,896 | 4,161 | 4,915 | 8,441 | 10,068 | 11,205 | 9,294 | 9,789 | 8,054 | 8,633 |
| 2010's | 22,045 | 22,430 | 24,389 | 22,763 | 23,824 | 26,029 | 27,830 | 27,105 | 48,923 | 49,181 |
| 2020's | 29,558 |
| - = No Data Reported; -- = Not Applicable; NA = Not Available; W = Withheld to avoid disclosure of individual company data. |
| Release Date: 2/9/2022 |
| Next Release Date: Suspended |