|
Download Data (XLS File) |
|
|||||
|
|||||
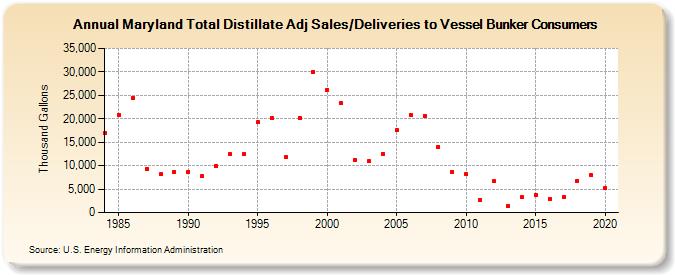
| Maryland Total Distillate Adj Sales/Deliveries to Vessel Bunker Consumers (Thousand Gallons) | |||||
| Decade | Year-0 | Year-1 | Year-2 | Year-3 | Year-4 | Year-5 | Year-6 | Year-7 | Year-8 | Year-9 |
|---|---|---|---|---|---|---|---|---|---|---|
| 1980's | 16,896 | 20,880 | 24,517 | 9,355 | 8,129 | 8,709 | ||||
| 1990's | 8,746 | 7,759 | 9,908 | 12,480 | 12,460 | 19,219 | 20,245 | 11,789 | 20,143 | 30,025 |
| 2000's | 26,193 | 23,264 | 11,177 | 10,910 | 12,561 | 17,555 | 20,811 | 20,677 | 14,031 | 8,702 |
| 2010's | 8,153 | 2,709 | 6,674 | 1,412 | 3,251 | 3,740 | 2,983 | 3,349 | 6,832 | 7,970 |
| 2020's | 5,253 |
| - = No Data Reported; -- = Not Applicable; NA = Not Available; W = Withheld to avoid disclosure of individual company data. |
| Release Date: 2/9/2022 |
| Next Release Date: Suspended |