|
Download Data (XLS File) |
|
|||||
|
|||||
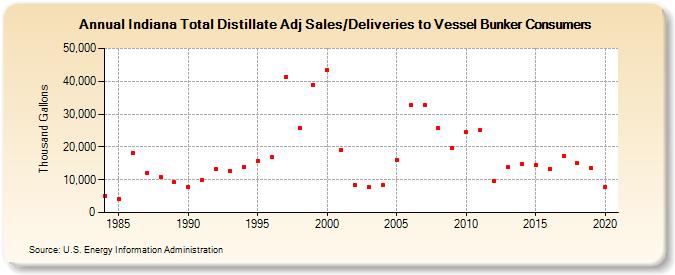
| Indiana Total Distillate Adj Sales/Deliveries to Vessel Bunker Consumers (Thousand Gallons) | |||||
| Decade | Year-0 | Year-1 | Year-2 | Year-3 | Year-4 | Year-5 | Year-6 | Year-7 | Year-8 | Year-9 |
|---|---|---|---|---|---|---|---|---|---|---|
| 1980's | 5,153 | 4,133 | 18,135 | 12,014 | 10,966 | 9,233 | ||||
| 1990's | 7,717 | 9,800 | 13,262 | 12,733 | 13,955 | 15,812 | 16,934 | 41,333 | 25,739 | 38,933 |
| 2000's | 43,353 | 19,050 | 8,379 | 7,738 | 8,347 | 16,101 | 32,772 | 32,784 | 25,723 | 19,535 |
| 2010's | 24,479 | 25,252 | 9,547 | 13,792 | 14,793 | 14,362 | 13,370 | 17,221 | 15,092 | 13,641 |
| 2020's | 7,880 |
| - = No Data Reported; -- = Not Applicable; NA = Not Available; W = Withheld to avoid disclosure of individual company data. |
| Release Date: 2/9/2022 |
| Next Release Date: Suspended |