|
Download Data (XLS File) |
|
|||||
|
|||||
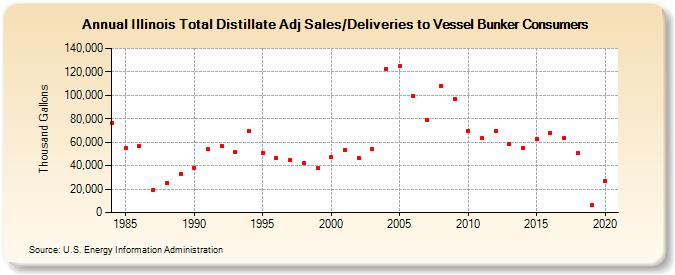
| Illinois Total Distillate Adj Sales/Deliveries to Vessel Bunker Consumers (Thousand Gallons) | |||||
| Decade | Year-0 | Year-1 | Year-2 | Year-3 | Year-4 | Year-5 | Year-6 | Year-7 | Year-8 | Year-9 |
|---|---|---|---|---|---|---|---|---|---|---|
| 1980's | 76,791 | 55,190 | 57,095 | 19,633 | 25,426 | 32,932 | ||||
| 1990's | 38,173 | 54,453 | 56,789 | 51,749 | 69,695 | 50,558 | 46,912 | 44,690 | 42,053 | 37,997 |
| 2000's | 47,133 | 53,658 | 46,318 | 53,906 | 122,666 | 125,149 | 99,386 | 78,982 | 108,142 | 96,870 |
| 2010's | 69,773 | 63,359 | 69,803 | 58,540 | 55,048 | 62,769 | 68,009 | 63,470 | 50,580 | 6,222 |
| 2020's | 26,836 |
| - = No Data Reported; -- = Not Applicable; NA = Not Available; W = Withheld to avoid disclosure of individual company data. |
| Release Date: 2/9/2022 |
| Next Release Date: Suspended |