|
Download Data (XLS File) |
|
|||||
|
|||||
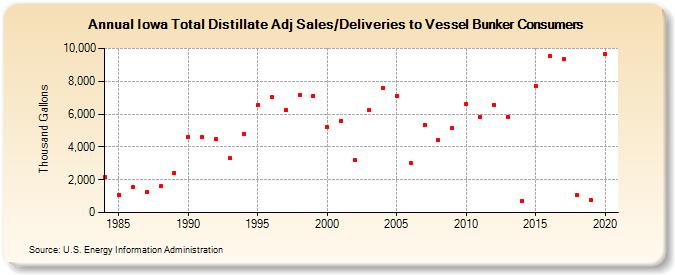
| Iowa Total Distillate Adj Sales/Deliveries to Vessel Bunker Consumers (Thousand Gallons) | |||||
| Decade | Year-0 | Year-1 | Year-2 | Year-3 | Year-4 | Year-5 | Year-6 | Year-7 | Year-8 | Year-9 |
|---|---|---|---|---|---|---|---|---|---|---|
| 1980's | 2,195 | 1,090 | 1,531 | 1,222 | 1,600 | 2,403 | ||||
| 1990's | 4,610 | 4,581 | 4,456 | 3,306 | 4,783 | 6,542 | 7,011 | 6,244 | 7,148 | 7,120 |
| 2000's | 5,202 | 5,592 | 3,186 | 6,254 | 7,614 | 7,124 | 3,037 | 5,354 | 4,408 | 5,147 |
| 2010's | 6,636 | 5,841 | 6,580 | 5,837 | 704 | 7,732 | 9,542 | 9,340 | 1,064 | 744 |
| 2020's | 9,673 |
| - = No Data Reported; -- = Not Applicable; NA = Not Available; W = Withheld to avoid disclosure of individual company data. |
| Release Date: 2/9/2022 |
| Next Release Date: Suspended |