|
Download Data (XLS File) |
|
|||||
|
|||||
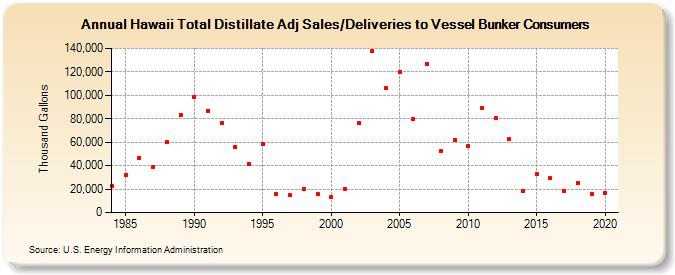
| Hawaii Total Distillate Adj Sales/Deliveries to Vessel Bunker Consumers (Thousand Gallons) | |||||
| Decade | Year-0 | Year-1 | Year-2 | Year-3 | Year-4 | Year-5 | Year-6 | Year-7 | Year-8 | Year-9 |
|---|---|---|---|---|---|---|---|---|---|---|
| 1980's | 23,064 | 31,938 | 46,608 | 39,061 | 60,545 | 82,832 | ||||
| 1990's | 98,661 | 86,843 | 76,226 | 56,065 | 41,684 | 58,171 | 15,613 | 15,038 | 20,368 | 15,683 |
| 2000's | 13,002 | 20,472 | 76,542 | 137,968 | 106,064 | 119,717 | 79,801 | 126,454 | 52,243 | 61,814 |
| 2010's | 56,944 | 89,341 | 80,962 | 62,712 | 18,686 | 33,160 | 29,190 | 18,467 | 25,152 | 16,084 |
| 2020's | 17,052 |
| - = No Data Reported; -- = Not Applicable; NA = Not Available; W = Withheld to avoid disclosure of individual company data. |
| Release Date: 2/9/2022 |
| Next Release Date: Suspended |