|
Download Data (XLS File) |
|
|||||
|
|||||
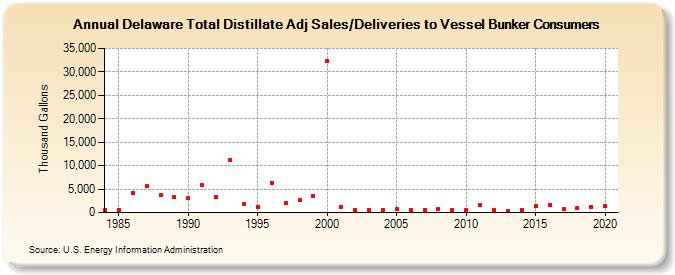
| Delaware Total Distillate Adj Sales/Deliveries to Vessel Bunker Consumers (Thousand Gallons) | |||||
| Decade | Year-0 | Year-1 | Year-2 | Year-3 | Year-4 | Year-5 | Year-6 | Year-7 | Year-8 | Year-9 |
|---|---|---|---|---|---|---|---|---|---|---|
| 1980's | 488 | 552 | 4,186 | 5,713 | 3,663 | 3,259 | ||||
| 1990's | 3,052 | 5,938 | 3,264 | 11,297 | 1,776 | 1,247 | 6,381 | 2,142 | 2,576 | 3,467 |
| 2000's | 32,340 | 1,158 | 590 | 647 | 594 | 666 | 449 | 595 | 781 | 615 |
| 2010's | 475 | 1,688 | 563 | 264 | 612 | 1,388 | 1,697 | 699 | 949 | 1,266 |
| 2020's | 1,482 |
| - = No Data Reported; -- = Not Applicable; NA = Not Available; W = Withheld to avoid disclosure of individual company data. |
| Release Date: 2/9/2022 |
| Next Release Date: Suspended |