|
Download Data (XLS File) |
|
|||||
|
|||||
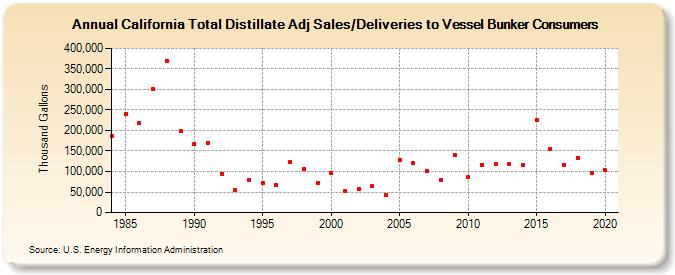
| California Total Distillate Adj Sales/Deliveries to Vessel Bunker Consumers (Thousand Gallons) | |||||
| Decade | Year-0 | Year-1 | Year-2 | Year-3 | Year-4 | Year-5 | Year-6 | Year-7 | Year-8 | Year-9 |
|---|---|---|---|---|---|---|---|---|---|---|
| 1980's | 185,498 | 240,241 | 217,325 | 301,011 | 370,162 | 198,830 | ||||
| 1990's | 166,401 | 169,805 | 95,082 | 54,032 | 78,655 | 73,101 | 65,966 | 124,356 | 105,189 | 73,039 |
| 2000's | 97,304 | 51,775 | 56,778 | 63,898 | 42,251 | 129,096 | 121,101 | 101,932 | 78,284 | 141,306 |
| 2010's | 85,755 | 116,672 | 118,682 | 118,682 | 115,232 | 226,671 | 154,830 | 115,748 | 134,153 | 96,332 |
| 2020's | 103,300 |
| - = No Data Reported; -- = Not Applicable; NA = Not Available; W = Withheld to avoid disclosure of individual company data. |
| Release Date: 2/9/2022 |
| Next Release Date: Suspended |