|
Download Data (XLS File) |
|
|||||
|
|||||
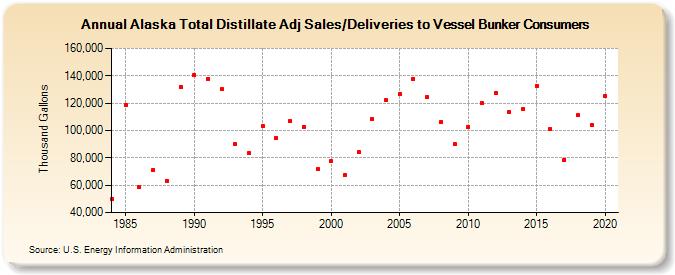
| Alaska Total Distillate Adj Sales/Deliveries to Vessel Bunker Consumers (Thousand Gallons) | |||||
| Decade | Year-0 | Year-1 | Year-2 | Year-3 | Year-4 | Year-5 | Year-6 | Year-7 | Year-8 | Year-9 |
|---|---|---|---|---|---|---|---|---|---|---|
| 1980's | 49,853 | 118,258 | 58,752 | 71,125 | 63,341 | 132,087 | ||||
| 1990's | 140,709 | 137,829 | 130,256 | 89,912 | 83,481 | 103,629 | 94,617 | 106,832 | 102,755 | 71,786 |
| 2000's | 77,671 | 67,380 | 84,143 | 108,241 | 121,962 | 126,812 | 137,696 | 124,379 | 106,165 | 90,025 |
| 2010's | 102,827 | 119,825 | 127,690 | 113,640 | 115,649 | 132,785 | 101,184 | 78,755 | 110,961 | 103,887 |
| 2020's | 125,378 |
| - = No Data Reported; -- = Not Applicable; NA = Not Available; W = Withheld to avoid disclosure of individual company data. |
| Release Date: 2/9/2022 |
| Next Release Date: Suspended |