|
Download Data (XLS File) |
|
|||||
|
|||||
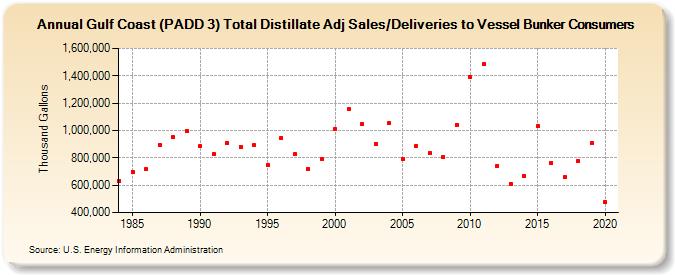
| Gulf Coast (PADD 3) Total Distillate Adj Sales/Deliveries to Vessel Bunker Consumers (Thousand Gallons) | |||||
| Decade | Year-0 | Year-1 | Year-2 | Year-3 | Year-4 | Year-5 | Year-6 | Year-7 | Year-8 | Year-9 |
|---|---|---|---|---|---|---|---|---|---|---|
| 1980's | 634,063 | 698,566 | 715,494 | 895,743 | 950,190 | 998,618 | ||||
| 1990's | 887,295 | 827,700 | 908,026 | 881,819 | 891,570 | 748,086 | 946,627 | 824,577 | 721,207 | 791,814 |
| 2000's | 1,012,022 | 1,156,237 | 1,049,051 | 904,719 | 1,055,650 | 792,507 | 886,820 | 837,094 | 803,255 | 1,042,270 |
| 2010's | 1,392,895 | 1,485,163 | 743,932 | 611,699 | 669,980 | 1,031,917 | 764,349 | 658,452 | 778,084 | 907,925 |
| 2020's | 478,816 |
| - = No Data Reported; -- = Not Applicable; NA = Not Available; W = Withheld to avoid disclosure of individual company data. |
| Release Date: 2/9/2022 |
| Next Release Date: Suspended |