|
Download Data (XLS File) |
|
|||||
|
|||||
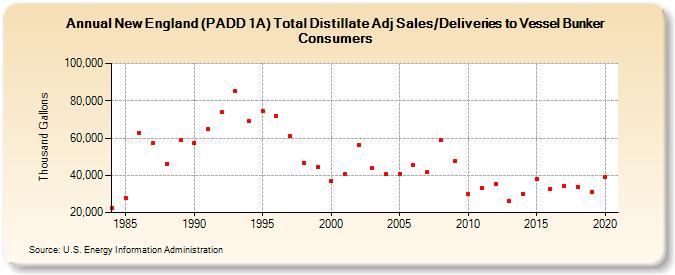
| New England (PADD 1A) Total Distillate Adj Sales/Deliveries to Vessel Bunker Consumers (Thousand Gallons) | |||||
| Decade | Year-0 | Year-1 | Year-2 | Year-3 | Year-4 | Year-5 | Year-6 | Year-7 | Year-8 | Year-9 |
|---|---|---|---|---|---|---|---|---|---|---|
| 1980's | 22,314 | 27,816 | 62,715 | 57,200 | 46,292 | 59,061 | ||||
| 1990's | 57,371 | 65,058 | 73,779 | 85,228 | 68,927 | 74,504 | 71,917 | 61,326 | 46,648 | 44,275 |
| 2000's | 37,111 | 40,657 | 56,382 | 43,833 | 40,460 | 40,624 | 45,257 | 41,600 | 58,737 | 47,677 |
| 2010's | 29,922 | 32,988 | 35,557 | 26,028 | 30,095 | 38,184 | 32,733 | 34,201 | 33,904 | 30,985 |
| 2020's | 39,010 |
| - = No Data Reported; -- = Not Applicable; NA = Not Available; W = Withheld to avoid disclosure of individual company data. |
| Release Date: 2/9/2022 |
| Next Release Date: Suspended |