|
Download Data (XLS File) |
|
|||||
|
|||||
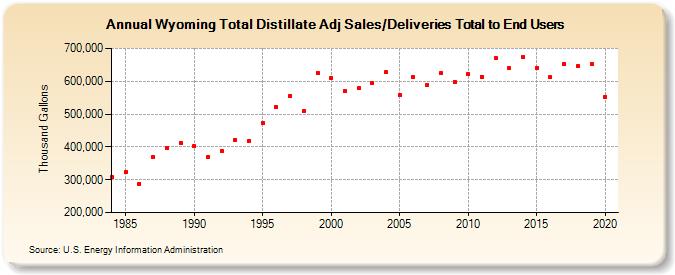
| Wyoming Total Distillate Adj Sales/Deliveries Total to End Users (Thousand Gallons) | |||||
| Decade | Year-0 | Year-1 | Year-2 | Year-3 | Year-4 | Year-5 | Year-6 | Year-7 | Year-8 | Year-9 |
|---|---|---|---|---|---|---|---|---|---|---|
| 1980's | 307,485 | 323,274 | 288,273 | 368,196 | 395,953 | 412,697 | ||||
| 1990's | 402,591 | 369,186 | 388,563 | 421,228 | 418,306 | 472,631 | 522,014 | 556,202 | 508,280 | 625,932 |
| 2000's | 610,181 | 569,722 | 578,489 | 594,987 | 626,856 | 556,630 | 612,438 | 589,170 | 624,466 | 597,786 |
| 2010's | 621,331 | 613,779 | 671,142 | 639,497 | 674,166 | 639,654 | 611,891 | 652,517 | 646,327 | 652,237 |
| 2020's | 552,861 |
| - = No Data Reported; -- = Not Applicable; NA = Not Available; W = Withheld to avoid disclosure of individual company data. |
| Release Date: 2/9/2022 |
| Next Release Date: Suspended |