|
Download Data (XLS File) |
|
|||||
|
|||||
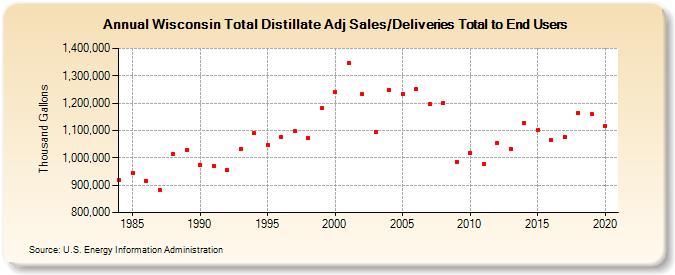
| Wisconsin Total Distillate Adj Sales/Deliveries Total to End Users (Thousand Gallons) | |||||
| Decade | Year-0 | Year-1 | Year-2 | Year-3 | Year-4 | Year-5 | Year-6 | Year-7 | Year-8 | Year-9 |
|---|---|---|---|---|---|---|---|---|---|---|
| 1980's | 918,428 | 945,672 | 916,666 | 883,384 | 1,015,329 | 1,029,655 | ||||
| 1990's | 974,827 | 970,836 | 955,255 | 1,033,614 | 1,090,342 | 1,047,969 | 1,074,538 | 1,097,231 | 1,071,986 | 1,180,918 |
| 2000's | 1,240,047 | 1,348,389 | 1,232,316 | 1,093,511 | 1,248,939 | 1,233,360 | 1,251,016 | 1,196,720 | 1,199,426 | 986,536 |
| 2010's | 1,018,958 | 978,726 | 1,053,193 | 1,032,621 | 1,128,745 | 1,102,031 | 1,066,073 | 1,076,669 | 1,165,060 | 1,160,902 |
| 2020's | 1,116,109 |
| - = No Data Reported; -- = Not Applicable; NA = Not Available; W = Withheld to avoid disclosure of individual company data. |
| Release Date: 2/9/2022 |
| Next Release Date: Suspended |