|
Download Data (XLS File) |
|
|||||
|
|||||
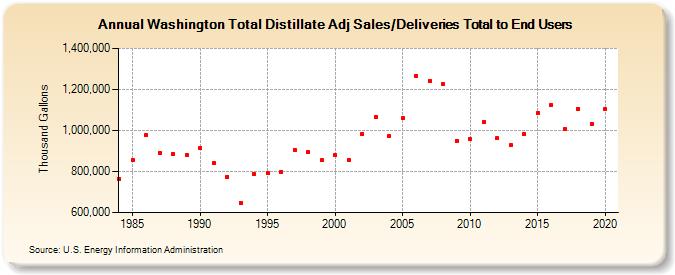
| Washington Total Distillate Adj Sales/Deliveries Total to End Users (Thousand Gallons) | |||||
| Decade | Year-0 | Year-1 | Year-2 | Year-3 | Year-4 | Year-5 | Year-6 | Year-7 | Year-8 | Year-9 |
|---|---|---|---|---|---|---|---|---|---|---|
| 1980's | 763,840 | 857,131 | 978,080 | 892,223 | 886,056 | 882,623 | ||||
| 1990's | 914,101 | 842,663 | 775,283 | 648,034 | 789,101 | 791,837 | 798,927 | 906,796 | 894,316 | 855,087 |
| 2000's | 879,754 | 857,418 | 982,875 | 1,064,194 | 973,068 | 1,058,628 | 1,267,655 | 1,242,436 | 1,224,306 | 950,974 |
| 2010's | 958,278 | 1,042,885 | 961,348 | 927,999 | 982,364 | 1,086,935 | 1,124,958 | 1,006,937 | 1,106,909 | 1,033,599 |
| 2020's | 1,102,866 |
| - = No Data Reported; -- = Not Applicable; NA = Not Available; W = Withheld to avoid disclosure of individual company data. |
| Release Date: 2/9/2022 |
| Next Release Date: Suspended |