|
Download Data (XLS File) |
|
|||||
|
|||||
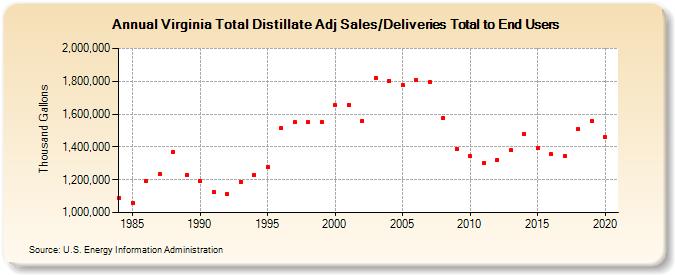
| Virginia Total Distillate Adj Sales/Deliveries Total to End Users (Thousand Gallons) | |||||
| Decade | Year-0 | Year-1 | Year-2 | Year-3 | Year-4 | Year-5 | Year-6 | Year-7 | Year-8 | Year-9 |
|---|---|---|---|---|---|---|---|---|---|---|
| 1980's | 1,089,818 | 1,061,052 | 1,194,423 | 1,233,151 | 1,371,623 | 1,230,064 | ||||
| 1990's | 1,189,252 | 1,127,880 | 1,110,076 | 1,188,157 | 1,230,342 | 1,278,162 | 1,514,881 | 1,548,908 | 1,549,089 | 1,552,847 |
| 2000's | 1,652,177 | 1,656,809 | 1,558,939 | 1,822,336 | 1,803,824 | 1,778,428 | 1,804,897 | 1,795,784 | 1,574,055 | 1,387,679 |
| 2010's | 1,343,002 | 1,303,516 | 1,322,857 | 1,378,726 | 1,480,143 | 1,392,675 | 1,354,285 | 1,342,316 | 1,510,112 | 1,557,965 |
| 2020's | 1,458,259 |
| - = No Data Reported; -- = Not Applicable; NA = Not Available; W = Withheld to avoid disclosure of individual company data. |
| Release Date: 2/9/2022 |
| Next Release Date: Suspended |