|
Download Data (XLS File) |
|
|||||
|
|||||
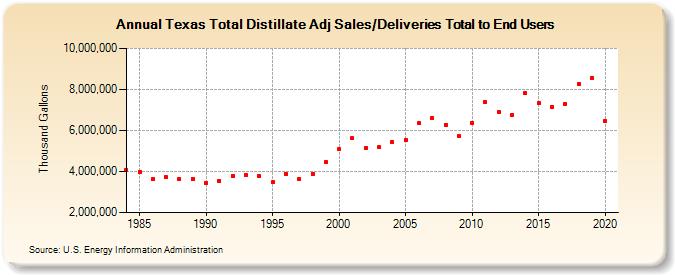
| Texas Total Distillate Adj Sales/Deliveries Total to End Users (Thousand Gallons) | |||||
| Decade | Year-0 | Year-1 | Year-2 | Year-3 | Year-4 | Year-5 | Year-6 | Year-7 | Year-8 | Year-9 |
|---|---|---|---|---|---|---|---|---|---|---|
| 1980's | 4,064,372 | 3,999,851 | 3,623,112 | 3,723,624 | 3,636,015 | 3,657,284 | ||||
| 1990's | 3,453,872 | 3,557,650 | 3,795,553 | 3,853,663 | 3,759,908 | 3,475,855 | 3,891,829 | 3,646,357 | 3,902,005 | 4,464,744 |
| 2000's | 5,081,758 | 5,621,685 | 5,168,430 | 5,178,338 | 5,428,103 | 5,549,505 | 6,355,735 | 6,597,994 | 6,280,184 | 5,741,296 |
| 2010's | 6,383,733 | 7,370,132 | 6,910,138 | 6,758,350 | 7,802,326 | 7,315,567 | 7,162,889 | 7,310,844 | 8,287,468 | 8,561,686 |
| 2020's | 6,465,848 |
| - = No Data Reported; -- = Not Applicable; NA = Not Available; W = Withheld to avoid disclosure of individual company data. |
| Release Date: 2/9/2022 |
| Next Release Date: Suspended |