|
Download Data (XLS File) |
|
|||||
|
|||||
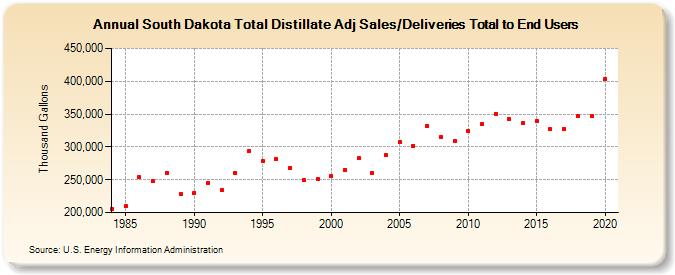
| South Dakota Total Distillate Adj Sales/Deliveries Total to End Users (Thousand Gallons) | |||||
| Decade | Year-0 | Year-1 | Year-2 | Year-3 | Year-4 | Year-5 | Year-6 | Year-7 | Year-8 | Year-9 |
|---|---|---|---|---|---|---|---|---|---|---|
| 1980's | 204,782 | 209,553 | 253,832 | 247,601 | 260,730 | 227,860 | ||||
| 1990's | 230,439 | 245,307 | 234,269 | 260,450 | 293,212 | 278,398 | 281,154 | 268,448 | 249,154 | 251,203 |
| 2000's | 255,487 | 265,468 | 282,379 | 260,448 | 287,707 | 307,357 | 301,881 | 332,209 | 315,408 | 308,432 |
| 2010's | 324,816 | 334,573 | 350,266 | 342,271 | 336,561 | 338,730 | 326,685 | 327,865 | 347,256 | 346,803 |
| 2020's | 403,601 |
| - = No Data Reported; -- = Not Applicable; NA = Not Available; W = Withheld to avoid disclosure of individual company data. |
| Release Date: 2/9/2022 |
| Next Release Date: Suspended |