|
Download Data (XLS File) |
|
|||||
|
|||||
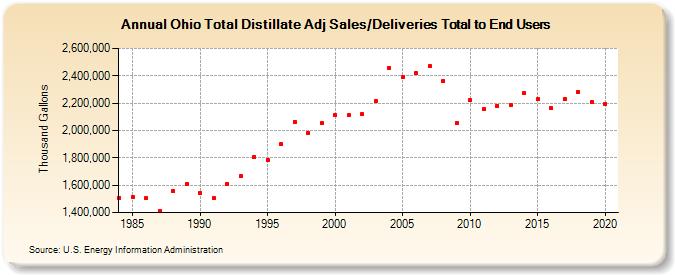
| Ohio Total Distillate Adj Sales/Deliveries Total to End Users (Thousand Gallons) | |||||
| Decade | Year-0 | Year-1 | Year-2 | Year-3 | Year-4 | Year-5 | Year-6 | Year-7 | Year-8 | Year-9 |
|---|---|---|---|---|---|---|---|---|---|---|
| 1980's | 1,507,314 | 1,514,893 | 1,504,194 | 1,409,305 | 1,553,942 | 1,605,659 | ||||
| 1990's | 1,542,528 | 1,503,902 | 1,607,986 | 1,666,842 | 1,807,709 | 1,787,557 | 1,898,980 | 2,064,183 | 1,984,408 | 2,053,019 |
| 2000's | 2,111,990 | 2,110,998 | 2,117,951 | 2,214,067 | 2,458,611 | 2,387,417 | 2,417,398 | 2,468,438 | 2,361,621 | 2,053,512 |
| 2010's | 2,224,138 | 2,156,341 | 2,180,958 | 2,184,313 | 2,271,805 | 2,228,586 | 2,160,989 | 2,229,745 | 2,282,814 | 2,207,703 |
| 2020's | 2,195,658 |
| - = No Data Reported; -- = Not Applicable; NA = Not Available; W = Withheld to avoid disclosure of individual company data. |
| Release Date: 2/9/2022 |
| Next Release Date: Suspended |