|
Download Data (XLS File) |
|
|||||
|
|||||
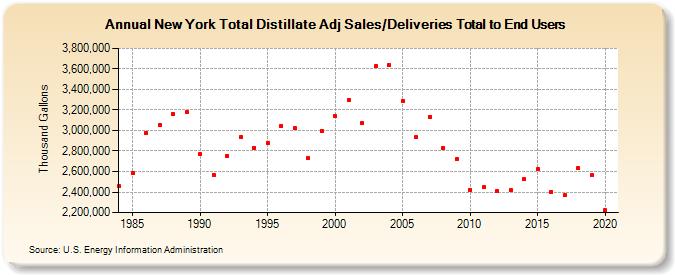
| New York Total Distillate Adj Sales/Deliveries Total to End Users (Thousand Gallons) | |||||
| Decade | Year-0 | Year-1 | Year-2 | Year-3 | Year-4 | Year-5 | Year-6 | Year-7 | Year-8 | Year-9 |
|---|---|---|---|---|---|---|---|---|---|---|
| 1980's | 2,456,086 | 2,583,539 | 2,975,734 | 3,051,777 | 3,159,737 | 3,178,401 | ||||
| 1990's | 2,771,355 | 2,566,694 | 2,753,653 | 2,933,859 | 2,831,682 | 2,878,395 | 3,043,983 | 3,023,396 | 2,728,609 | 2,997,164 |
| 2000's | 3,136,459 | 3,299,849 | 3,071,282 | 3,624,395 | 3,637,143 | 3,285,224 | 2,933,711 | 3,133,786 | 2,828,673 | 2,720,019 |
| 2010's | 2,423,984 | 2,444,275 | 2,410,516 | 2,415,630 | 2,524,454 | 2,621,582 | 2,404,442 | 2,367,710 | 2,631,533 | 2,561,557 |
| 2020's | 2,220,733 |
| - = No Data Reported; -- = Not Applicable; NA = Not Available; W = Withheld to avoid disclosure of individual company data. |
| Release Date: 2/9/2022 |
| Next Release Date: Suspended |