|
Download Data (XLS File) |
|
|||||
|
|||||
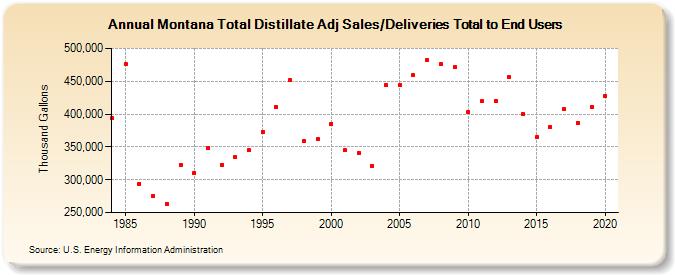
| Montana Total Distillate Adj Sales/Deliveries Total to End Users (Thousand Gallons) | |||||
| Decade | Year-0 | Year-1 | Year-2 | Year-3 | Year-4 | Year-5 | Year-6 | Year-7 | Year-8 | Year-9 |
|---|---|---|---|---|---|---|---|---|---|---|
| 1980's | 393,372 | 476,035 | 293,970 | 275,031 | 263,266 | 322,470 | ||||
| 1990's | 310,213 | 348,697 | 322,882 | 333,952 | 344,521 | 372,993 | 410,918 | 451,125 | 359,002 | 362,203 |
| 2000's | 385,421 | 344,622 | 341,141 | 321,336 | 444,619 | 444,170 | 459,007 | 481,663 | 476,119 | 471,456 |
| 2010's | 403,162 | 419,132 | 420,415 | 456,237 | 399,952 | 364,904 | 380,156 | 407,079 | 386,896 | 410,476 |
| 2020's | 427,601 |
| - = No Data Reported; -- = Not Applicable; NA = Not Available; W = Withheld to avoid disclosure of individual company data. |
| Release Date: 2/9/2022 |
| Next Release Date: Suspended |