|
Download Data (XLS File) |
|
|||||
|
|||||
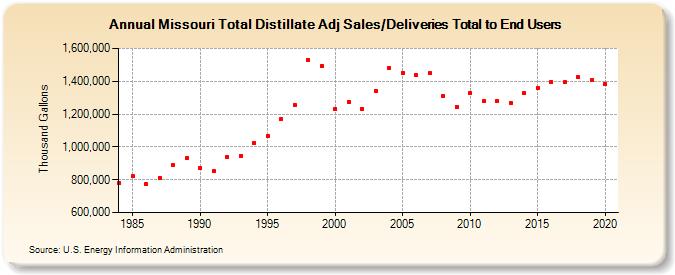
| Missouri Total Distillate Adj Sales/Deliveries Total to End Users (Thousand Gallons) | |||||
| Decade | Year-0 | Year-1 | Year-2 | Year-3 | Year-4 | Year-5 | Year-6 | Year-7 | Year-8 | Year-9 |
|---|---|---|---|---|---|---|---|---|---|---|
| 1980's | 778,821 | 820,356 | 771,022 | 812,428 | 888,098 | 929,681 | ||||
| 1990's | 869,301 | 851,898 | 939,722 | 946,086 | 1,026,541 | 1,068,260 | 1,166,996 | 1,255,718 | 1,531,401 | 1,495,650 |
| 2000's | 1,232,919 | 1,275,349 | 1,232,981 | 1,340,722 | 1,480,653 | 1,452,538 | 1,435,842 | 1,448,833 | 1,310,087 | 1,245,541 |
| 2010's | 1,328,881 | 1,277,747 | 1,279,218 | 1,269,688 | 1,327,247 | 1,361,318 | 1,395,971 | 1,393,737 | 1,424,972 | 1,405,136 |
| 2020's | 1,385,279 |
| - = No Data Reported; -- = Not Applicable; NA = Not Available; W = Withheld to avoid disclosure of individual company data. |
| Release Date: 2/9/2022 |
| Next Release Date: Suspended |