|
Download Data (XLS File) |
|
|||||
|
|||||
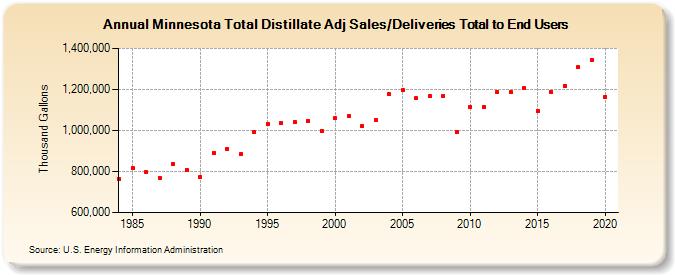
| Minnesota Total Distillate Adj Sales/Deliveries Total to End Users (Thousand Gallons) | |||||
| Decade | Year-0 | Year-1 | Year-2 | Year-3 | Year-4 | Year-5 | Year-6 | Year-7 | Year-8 | Year-9 |
|---|---|---|---|---|---|---|---|---|---|---|
| 1980's | 761,953 | 817,435 | 796,141 | 769,690 | 838,945 | 809,017 | ||||
| 1990's | 774,908 | 892,255 | 909,732 | 884,814 | 994,589 | 1,032,553 | 1,036,628 | 1,040,868 | 1,048,375 | 999,390 |
| 2000's | 1,060,301 | 1,070,512 | 1,021,567 | 1,049,866 | 1,175,915 | 1,197,674 | 1,156,824 | 1,167,979 | 1,168,749 | 991,323 |
| 2010's | 1,116,254 | 1,115,271 | 1,187,284 | 1,185,079 | 1,206,688 | 1,096,553 | 1,189,649 | 1,218,289 | 1,307,414 | 1,344,440 |
| 2020's | 1,164,466 |
| - = No Data Reported; -- = Not Applicable; NA = Not Available; W = Withheld to avoid disclosure of individual company data. |
| Release Date: 2/9/2022 |
| Next Release Date: Suspended |